You may select specific portions of stripcharts to be saved. Editing must be done in Stand Alone Mode. Any loaded stripchart may be edited.
![]()
Positioning and sizing buttons can be found below the
Start button. Using these buttons turns off your Auto-Scaling feature but it can
be reactivated by pushing the button rightmost button with two curved
arrows. Left and right Arrow buttons turn off automatic scrolling
when data is being collected. The data will still be received in the background
but in order to start scrolling again you must click the Plot/Autoscroll button ![]() Note, the buttons with the single arrows move the view of the imaginary chart
paper up and down so pressing up will actually make the chart data appear lower in
the chart.
Note, the buttons with the single arrows move the view of the imaginary chart
paper up and down so pressing up will actually make the chart data appear lower in
the chart.
The four leftmost buttons shown above expand or contract the chart width or height. Expanding the chart width actually makes the data appear smaller, just as if you were now using a larger piece of chart paper. Experiment with this and you will get the hang of it quickly.
After right clicking one of these buttons you can drag you mouse on the chart to smoothly continue the process of scrolling or resizing. Its hard to explain, just try it! If you use the right click method any chart that is active, that is, having new data added, will cease to scroll automatically. Remember to use the Plot/Autoscroll button to re-enable scrolling.
![]() Manual Entry
Manual Entry
You may manually enter the area of the chart you wish to view using this button.
The panel shown below will appear:
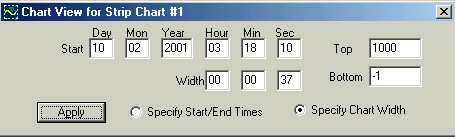
Press the apply button to jump to the area you want to see as described in the
appropriate date/time and width boxes. You may initiate multiple Manual
Entry panels. This is useful for jumping between several set views of the chart.
![]() Important :
Re-enable scrolling!
Important :
Re-enable scrolling!
Buttons may be used while data is being collected, however you will have to press the Plot-Enable Scrolling button to have the chart again scroll with the newly arriving data.
![]() Zoom Box
Zoom Box
The on-chart Toolbar also has a Zoom-Box feature shown highlighted
above. This allows you to drag a rectangular region on the chart and zoom in on
it. Resume plotting using the Plot button ![]()
![]() Cursor Button
Cursor Button
A cursor which may be selected by clicking on that option. The cursor is a vertical line which appears on the chart. The values for the data point where the cursor is positioned appear below the chart in the status bar. If more than one channel is on the chart the cursor can be applied to any channel you wish. To switch to another channel simply click the right mouse button on the chart. The cursor will appear in the color of the channel it applies to.
![]() Full View
Full View
The Full View button forces the entire observation onto a single chart window. The need for this will become apparent when dealing with long charts as it make the selection of a single portion of the chart much easier using the Toolbar's Zoom Box feature.
The Save View button selects the time chunk of the chart data which appears on the screen at the the time the button is pushed. You are then prompted for a file name (though a suggested name is automatically generated). This is your primary editing function and you you should experiment with using it.
A separate window appears which shows and allows editing of most of the header information that is associated with the observation. Use the Edit button on this window to allow modification and press Keep after the changes have been made. This window may also be summoned in Stand Alone mode by selecting View/Data File Info after a file is loaded.
You are not allowed to edit the start and end times in this box, however, Pro Edition users can modify all of the timestamps of a given observation using the Process/Modify Time Stamps options which appears on their screens. This is handy for recording and observation on tape, playing it back and charting through the sound card, and then correcting the times to reflect when the observation was actually made.