System Timer Resolution
Normally, SkyPipe uses software timers in your computer to trigger data
collection events. Two types of timers are available in Windows operating
systems; a low resolution (approximately 18 times per second) timer, and a high
resolution timer based on the multimedia timer which has about a 1 millisecond
resolution. On some computers, especially newer, faster machines using the
higher resolution timer can affect the system clock causing it to run fast. For
this reason the Low resolution timer is by default the selected timer. However,
you may experiment with the high resolution timer and see if your PC runs
correctly when it is used. If your PC does OK then you will have the ability to
collect more samples per second than those using the low resolution timer.
Hi Res Timer Priority
If you are using the Hi Resolution timer you may experiment with the priority
assigned to the timer in the multitasking Windows environment. Priority levels
run from 1 to 6, with 6 being the setting that gives highest priority to the
timer. This might also be the setting that gives the worst system performance,
so take note of which setting works best for you.
The stripchart will attempt to sample data at the rate in milliseconds (thousandths of a second) that you indicate in this setting. If the computer is unable to sample as fast as the speed you indicate, it will simply sample as quickly as it can.
Indicates the desired width of the stripchart viewing area in seconds.
Average Server/StandAlone Modes
Sets the number of samples you wish to average together for each data point when acting in Server or Stand Alone Modes. For example, if you have a Sample Rate of 100 ms. (100 milliseconds) and Average set to 5, then you will effectively save and display data points every 5*100 = 500 ms. (one half second or two samples per second). Averaging samples is appropriate for some types of observations and not for others. Observations which are intended to record quickly changing values such as pulses, should not be averaged. When Average is set to 1 (one), no averaging takes place and each sample is recorded.
Averages samples while in Client Mode from a remote stripchart server. The original samples received from the server are averaged and cannot be re-created from the stored data. See Average Server/StandAlone Modes for more explanation of averaging.
This is the upper value to which the Y axis of the stripchart will be set when Y Axis Autoscaling is not selected, (see Y Axis Autoscale below). Normally you would set this value based upon the expect upper value from your soundcard or ADC. The MAX187 and MAX186 ADCs have an upper value of 4095 (representing 4.095 volts). The upper value for a 16 bit soundcard is normally 32767.
Place a check in this box to enable automatic scaling of the stripchart Y axis to the sampled data range. The height of the chart will then change to accommodate the largest value in the current chart. While convenient for displaying a chart of an unknown range of values, autoscaling causes you to lose control of the displayed Y axis range while the stripchart is "running", that is, actively taking in new samples.
Update Server/StandAlone Chart Every ____ Samples
One of the most time consuming tasks the computer must perform is redrawing the chart each time a new data point arrives. You can improve performance by updating the chart only after a selected number of samples has been collected. This does not directly affect the sample rate except that it may allow you to sample faster than you might be able to sample when continually updating the chart viewing area for every sample. If for example, you set this chart update value to 10 and and had a sample period of 50 ms. then the chart would be redrawn each 10*50 = 500 ms.. All of the data points would be displayed. Nothing would be lost, only the chart would appear a little less smooth in its scrolling.
Update Client Client Chart Every ____ Samples
If your computer is having trouble keeping up with the stripchart data stream arriving from a remote R-SP stripchart server, you may find improved performance by setting this value to something higher than 1 (one). No data will be lost by doing this (and in fact, data may be captured which would otherwise be lost), however, the time that the computer must devote to drawing the stripchart is greatly reduced by a factor proportional to the value you choose. This is not usually necessary for slow data rates.
One Click Auto Increment
The value you put in this box will determine the amount by which the screen
updates when using the One Click Arrow Buttons. For example if 50 (%) is
entered, then clicking the right arrow button will advance the X axis by 50% of
its current span. If one hour of data was displayed, the time coordinates would
be advanced by 30 minutes.
Key Press Averaging Period
You can find the an average value for live data arriving in a chart over a
period of X seconds by pressing the ALT key and a number key corresponding to
the channel number you want to average. For example, pressing ALT and the
"2" key will begin calculating the incoming average for channel
2. The duration in seconds for the averaging is the Key Press Averaging
Period.
Pressing this button brings up the screen below where you can configure some of the charts appearance:
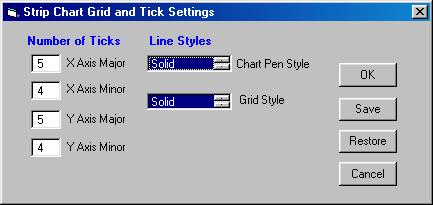
Make sure the chart pen style and grid style selections are actually highlighted (by clicking in the box) before saving.
You may apply color coded labels to be optionally viewed on the chart.
These labels would ordinarily give a very short description of what the channel
data references. When the chart is displayed you make these labels visible by
selecting View/Channel Legend.
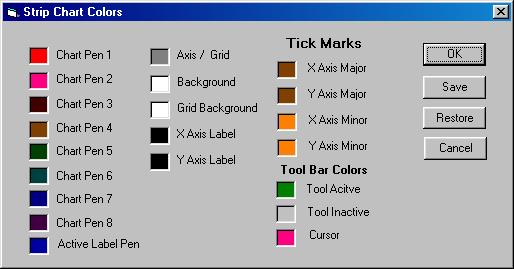
Click in the appropriate box to bring up a color palette to make your color selection.
Radio-SkyPipe Pro version users can define default channel offsets which can
be applied to their charts. This is most useful for multi-channel charts.
Click the Channel Offsets button for a small panel to define the individual channel
offset values.
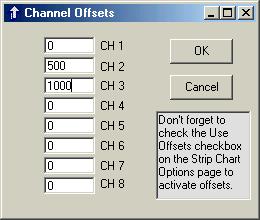
The Use Offsets checkbox must be checked for the offsets to be automatically applied whenever a chart is started in Stand Alone or Server mode. To send these offsets to clients, and thus separate the channels on their screens as they receive your data, check the Send Offsets to Clients checkbox.
Optional X and Y axis labels may be applied by default to your charts. Pushing the Axis Labels button brings up the following panel:
You may also access this panel from the menu bar on the main window of the program under View / Chart Text /XY Axis Labels.
This panel determines whether or not a file will be loaded with the offsets that
are locally applied by this configuration of Radio-SkyPipe, and whether or not
to apply the offsets that were used when the data was saved by this or another
instance of the program. Optionally, you display whether or not to prompt for
these whenever you load a file.